


Pipe up about #UsingYourNoggin
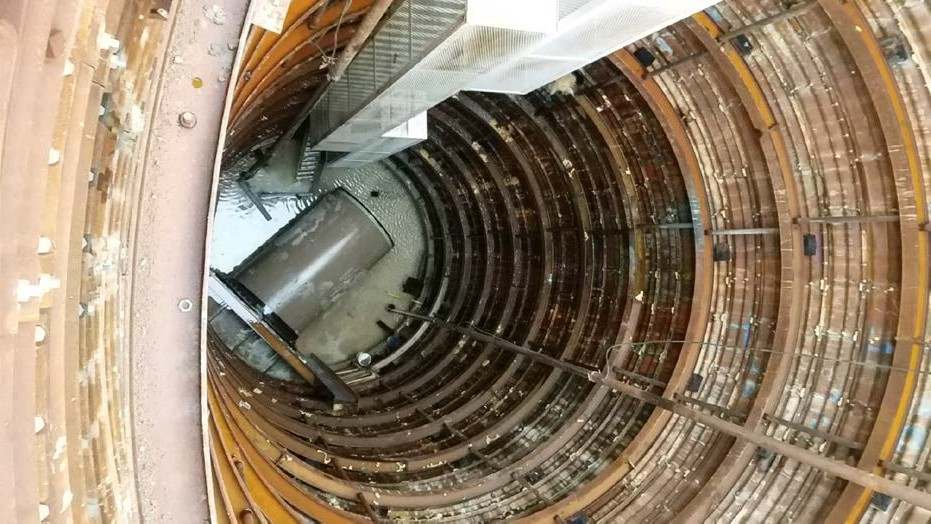
A 7-foot diameter fiber-reinforced plastic (FRP) sewer pipe was being installed via a microtunnel boring machine (MTBM) at a depth of approximately 40 feet below the ground surface (Figure 1). After the installation of a 530 foot section of the sewer pipe, areas of surface subsidence (sinkholes) were noted along the trend of the sewer pipe.
Due to the concern that the tunneling work had undermined the area, threatening the integrity of a public roadway, Prism Geoimaging, a full-service geophysical investigations provider in the US, was contracted to image the subsurface in the subsided areas. The goal was to trace the source of the subsidence and indicate where remediation efforts should be focused.
Geophysical Methods
Three separate geophysical methods were used for this project, namely ground penetrating radar (GPR), electrical resistivity tomography (EIT) and seismic refraction imaging. Seismic imaging was successful at tracing the path of the subsidence from the ground surface down to the top of the pipe while GPR was used to scan upwards from the ceiling of the sewer pipe towards the surface; making use of the portable and flexible Noggin® 250 SmartCart® GPR system.
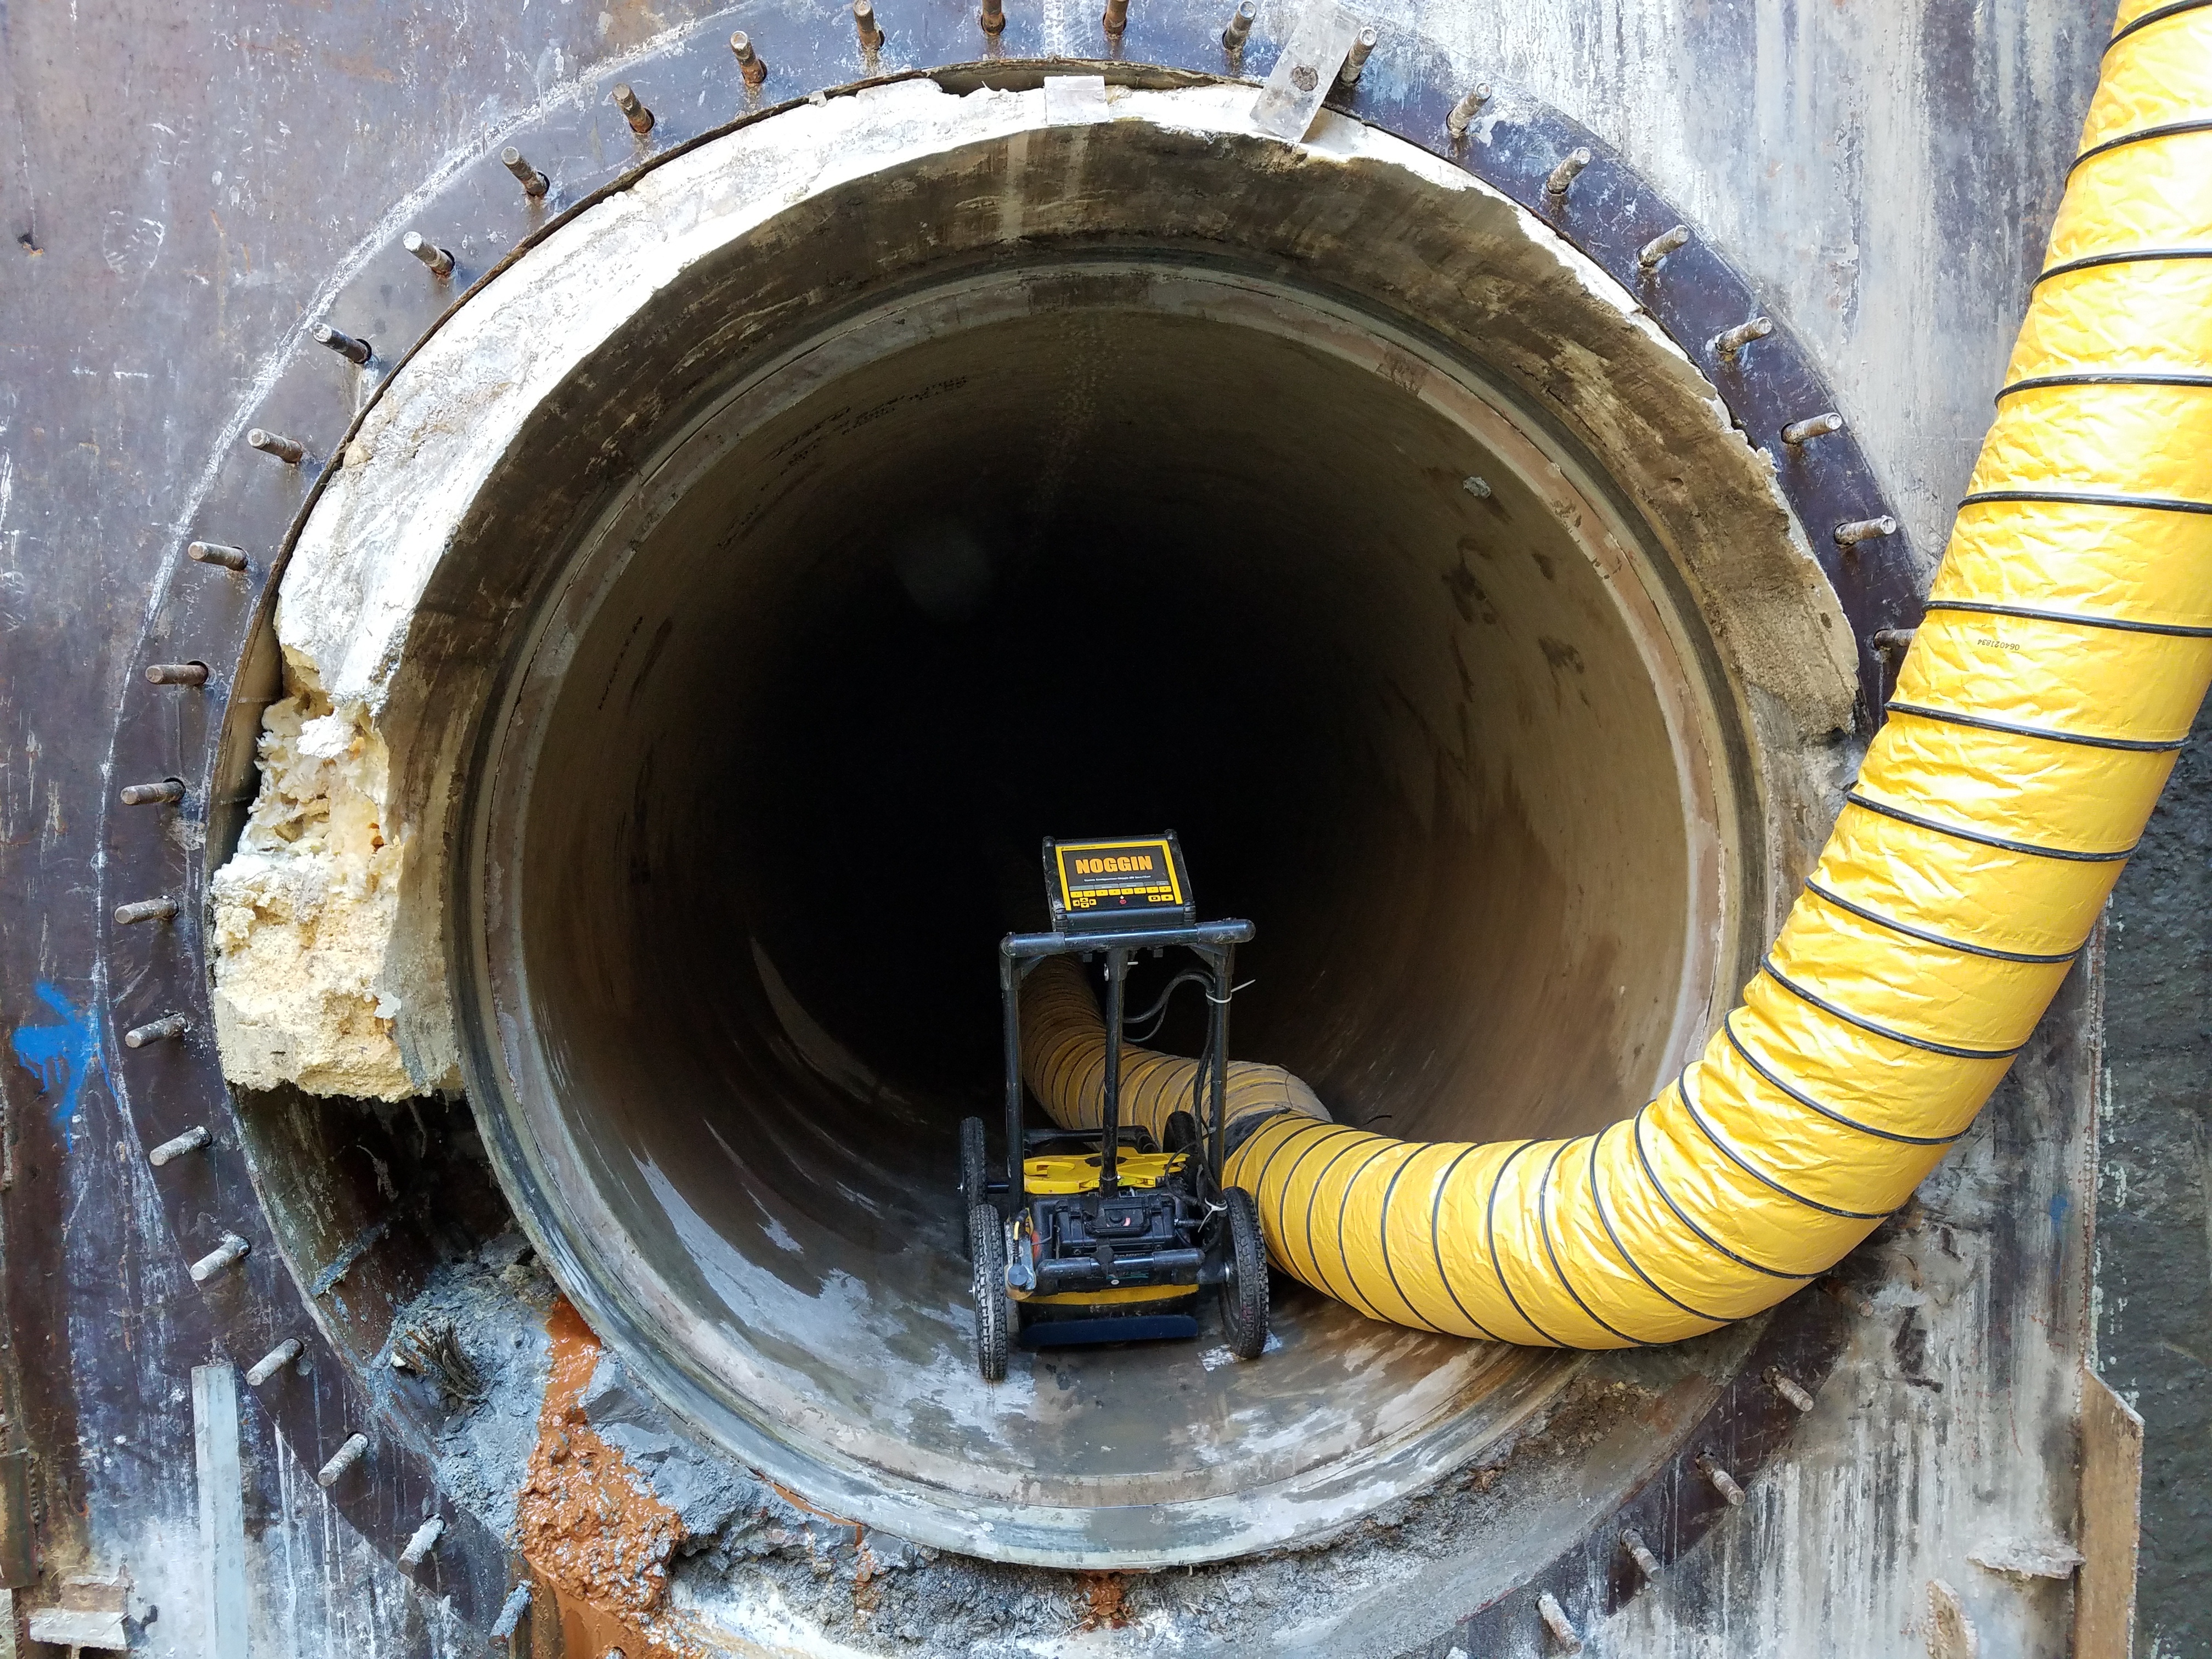
Collecting the GPR data was accomplished using a custom fabricated lift cart that held a flipped upside- down SmartCart® to maintain firm contact between the ceiling and the bottom of the Noggin® 250. Using the odometer wheel for triggering, data was then collected as the cart ran along the entire length of the pipe (Figure 2). For control and comparison purposes, an additional GPR line was collected along the floor of the pipe, scanning downward into the ground and both data sets were then processed and analyzed with Sensors & Software’s all-inclusive GPR software solution, EKKO_Project™.
Results and Interpretations
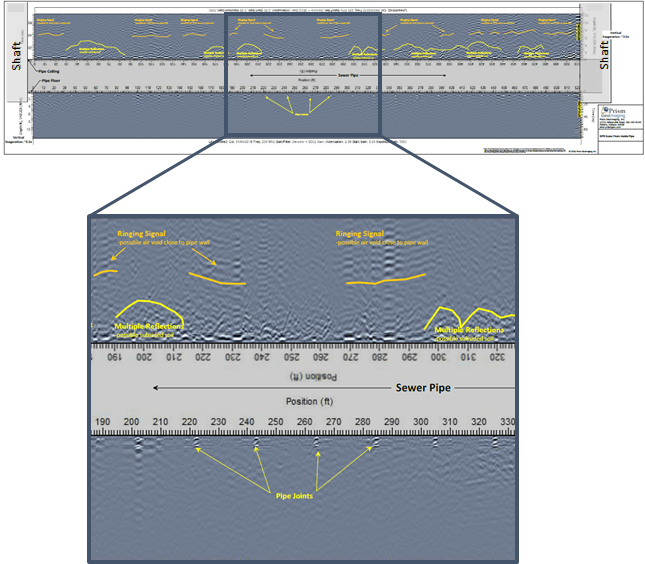
The GPR data showed a maximum signal penetration of 6 to 8 feet, both upward and downward (Figure 3). The GPR line below the pipe had a few reflections but no anomalies of note with the most prominent reflections being from the pipe joints (Figure 3, bottom). In contrast, the data from the top of the pipe revealed several strong reflectors with a series of ringing signals appearing close to 8 feet from the top of the pipe; indicative of an air gap between the pipe and the soil. The immediate area above the pipe also has multiple reflections that were consistent with slumped or subsided soil, likely due to the natural depositional bedding being disrupted. GPR combined with seismic refraction imaging proved most effective in this geophysical investigation with both methods highlighting anomalous areas consistent with the greatest volume of undermined soil; allowing for focused remediation efforts.
Story courtesy of John Vanderlaan of Prism Geoimaging.


